Where were residential schools located in Canada and when did they operate?
Grades 5 - 9
The Truth and Reconciliation Commission of Canada (TRC) was created in 2008 to bring to light the experiences of Indigenous students in residential schools throughout Canada’s history. In December 2015, the TRC released its final report, providing a detailed account of the history of residential schools, their devastating legacy, and the abuse inflicted upon generations of Indigenous children.
The Truth and Reconciliation Commission put forth several Calls to Action, with a specific focus on education, most notably Call to Action 62:
62. We call upon the federal, provincial, and territorial governments, in consultation and collaboration with Survivors, Aboriginal peoples, and educators, to:
i. Make an age-appropriate curriculum on residential schools, Treaties, and Aboriginal peoples' historical and contemporary contributions to Canada a mandatory education requirement for Kindergarten to Grade Twelve students.
A student-friendly version of the Calls to Action can be found here for further investigation.
The intention of this data exercise is to raise awareness about residential schools with animated graphs that explore the history of these institutions.
To answer our question we:
Used data from this open-source data set about residential schools.
Visualizing the data
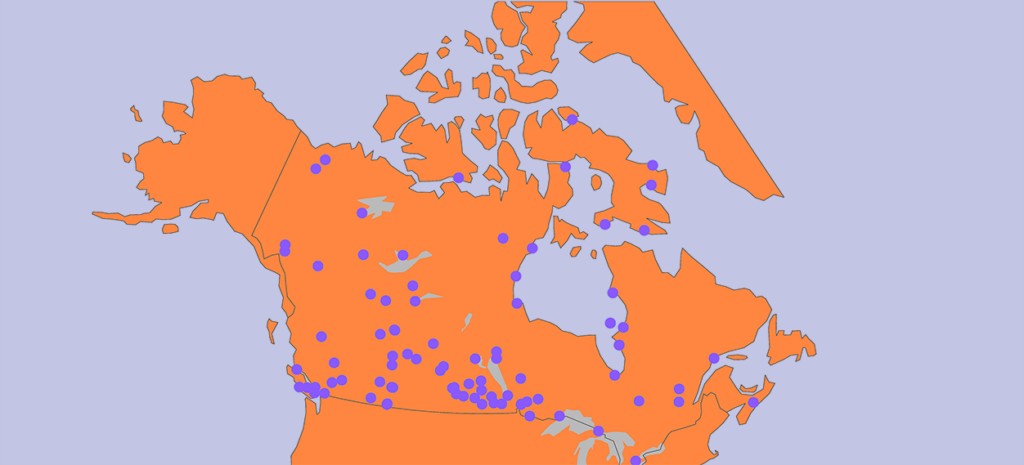
First, we plotted a map with the locations of the schools, complemented by a timeline indicating the opening and closing dates of each institution.
The timeline at the bottom of the map indicates that residential schools in Canada first opened in 1841, with the last one closing in 1997. Running the animation, we see that during the period from 1841 to the 1860s, only one school was operational. Numerous residential schools came into existence later in the 1800s and early 1900s.
Continuing our exploration, we created a map with coloured markers indicating the churches associated with different residential schools. Take a look at the map below. How many different churches are indicated? Running the animation, can you see in which regions the residential schools were located? When did most of these schools close down?
Some questions you might like to explore with these visualizations:
- Which part of the country had the first residential schools?
- Which areas of the country had the most residential schools?
- Which church or churches seem to be associated with most schools?
- When did the first “non-denominational” schools appear?
- Click on the names in the legend “Affiliations” to select or unselect the various items, so only the ones you want to see appear in the animation.
- In which part of the country did the non-denominational schools appear?
- As mentioned before, click on the legend to select/unselect the items of interest
Where was the last residential school to close in the country located?
- As mentioned before, click on the legend to select/unselect the items of interest
Suggestions for further exploration
- Why do you think certain geographic areas had more residential schools? Can you do research to confirm your answer?
Reflect on what you see
Look and interact with the data visualizations above. When you hover your mouse over the plots, you’ll notice more information appears. You can also use the legend to make plots appear and disappear.
Think about the following questions.
- What do you notice about the animated graphs?
- What do you wonder about the data?
Use the fill-in-the-blank prompts to summarize your thoughts.
- “I used to think _______”
- “Now I think _______”
- “I wish I knew more about _______”
- “These data visualizations remind me of _______”
- "I really like _______”
Learn how we visualized the data
Go to our walk-through (in Jupyter notebook format) to see how the data science process was applied to create these graphs, from formulating a question to gathering the data and analyzing the data with code.