What is Data Science?
Data science is a field of study as well as a set of skills aimed at finding patterns or drawing conclusions from large datasets. It can help make more informed decisions, answer questions, and discover new directions to look in. Though the field has existed, in some form, for decades, the availability of large datasets, accessibility to computing and data storage, and advancements in computing algorithms have significantly advanced data science capabilities.
With computers — and, by extension, data — becoming commonplace, it’s increasingly important for people to be comfortable reading, understanding, interpreting, and communicating using data. This is known as data literacy, a key outcome of studying data science. Additionally, data science relies heavily on mathematics and statistics, and so can serve as a practical application to develop those quantitative skills.
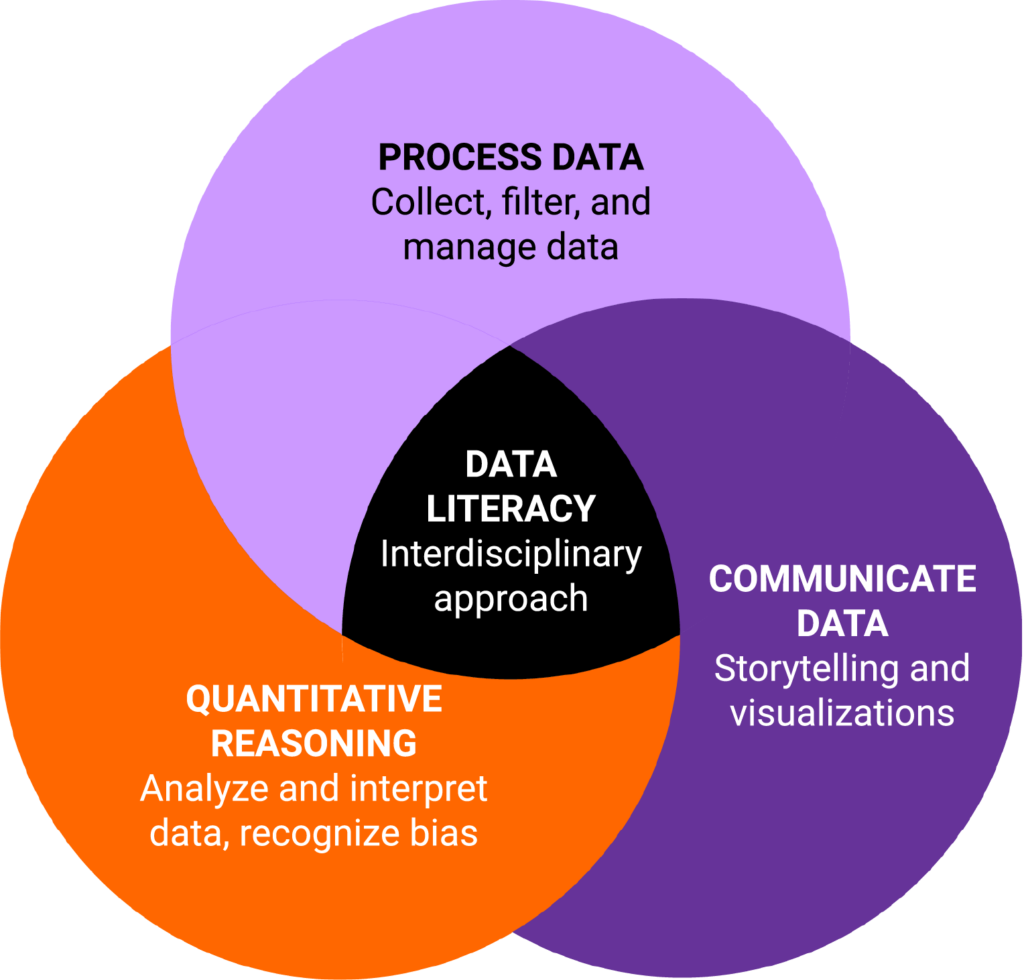
Components of data literacy. Comfort in interacting with data includes several components. The technical skills to find data and bring it into an environment you can control (often through programming) are often the first steps learned by those looking to improve their data literacy. Bringing together statistical techniques and background knowledge help to guide analysis, and the ability to demonstrate findings through visualization and storytelling, round off the key components of data literacy.
What is an effective way to interpret and communicate our data science findings?
A visual representation, such as graphs, charts, or maps, can help us see trends and relationships in our data.
A critical step to drawing conclusions and demonstrating meaning is analyzing and visualizing the data. Storytelling is also a key skill for data scientists, allowing them to build a narrative based on the analysis and interpretation of the data
What are some data science tools?
Programming languages, like Python, often form the basis of data analysis. Interactive file formats (like Jupyter notebooks) are an excellent way to learn and apply data science techniques. Both are accessible through our Callysto Hub, a free-to-use, browser-based coding environment. Curious learners can get started right away without the need to install any software on their computers.
Example of data visualization. This line graph shows how the total number of athletes participating in a Winter Olympics changes over its history. This visualization highlights particular points of interest in the underlying data that might not be as obvious if we were looking at raw numbers. For example, the number of athletes has been increasing nearly every year, but we might want to ask questions about the years where that pattern did not hold true. Similarly, the plotted line seems to be showing changes every four years, with the exception of 1992-1994, as 1994 was the first year that the Winter Olympics were moved to occur the two years before/after the Summer Olympics.
What role does data science provide in education?
As part of developing their data literacy, students learn to apply computational thinking skills, which involves analyzing complex problems and breaking them down into smaller, simpler steps to discover solutions. This is similar to how a computer scientist would program a computer to solve a problem, but the process can be generalized and applied outside of computing. The ability to answer questions with data and form new questions to further explore is an important skill, even outside of employment, that can help us engage with the world around us and contribute to our communities.
Have questions? We’re here to help.
Email contact@callysto.ca if you have questions about how to use Callysto in your classroom.

STAY IN THE KNOW
Stay up to date with all things Callysto by subscribing to our newsletter.