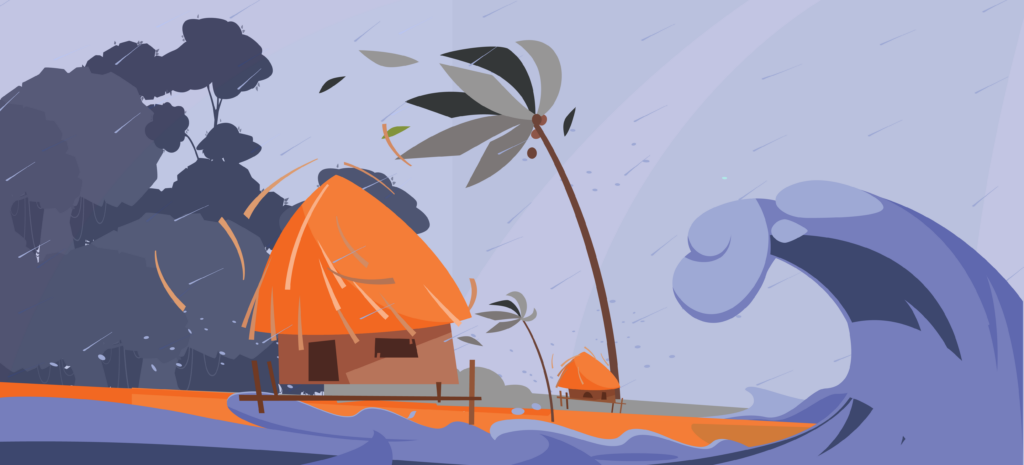
What have been the most expensive natural disasters in Canada’s history?
Grades 5 - 9
The costs of natural disasters can go beyond the immediate damage they cause. They can have both long-lasting economic and social impacts on affected communities. Understanding the costs associated with such events can help us better prepare for and respond to future calamities.
This week's data visualization investigates the most expensive disasters in recent history.
To answer our question we:
Used publicly available data from Public Safety Canada.
Visualizing the data
First, we examined the total cost of all disasters in the dataset that fit a specific subtype, such as floods, wildfires, and winter storms. To ensure that costs from the past were comparable to current-day amounts, we “normalized” the total cost. This is because costs tend to go up over time due to various reasons (this is known as “inflation”). We normalized the costs to 2016, the latest year for which our data source had available cost information.
From the following graph, we can see that floods have had the greatest financial impact on Canadians. The total cost of all floods in this dataset was over $500 million.
Then, we examined the total insurance cost for each type of disaster to create the graph below. The Y axis shows the total insurance cost, and the X axis shows the types of disasters.
What do you notice about the two graphs?
Lastly, we generated a scatter plot to visualize the cost of each disaster event in the dataset. The colour of the dots represents different types of disasters. The X and Y axes represent time and cost, respectively.
You can see that most of the disaster events were in the same range for cost, with some major outliers. Another group of dots represents disasters whose total costs were slightly higher. From this scatter plot, we can see a few dots that represent outlier events that had a much higher cost compared to the other events in the dataset. For example, the total normalized cost of a 1998 winter storm was over $300 million.
- What kind of costs do you think are associated with disasters?
- What type of disasters were the most expensive events?
- Have the most expensive events happened more recently?
Reflect on what you see
Look and interact with the data visualizations above. When you hover your mouse over the plots, you’ll notice more information appears. You can also use the legend to make plots appear and disappear.
Think about the following questions.
- What do you notice about these graphs?
- What do you wonder about the data?
Use the fill-in-the-blank prompts to summarize your thoughts.
- “I used to think _______”
- “Now I think _______”
- “I wish I knew more about _______”
- “These data visualizations remind me of _______”
- "I really like _______”
Learn how we visualized the data
Go to our walk-through (in Jupyter notebook format) to see how the data science process was applied to create these graphs, from formulating a question to gathering the data and analyzing the data with code.