How many Canadians have disabilities compared to those without? What are the employment rates among Canadians with disabilities?
Grades 5 - 9
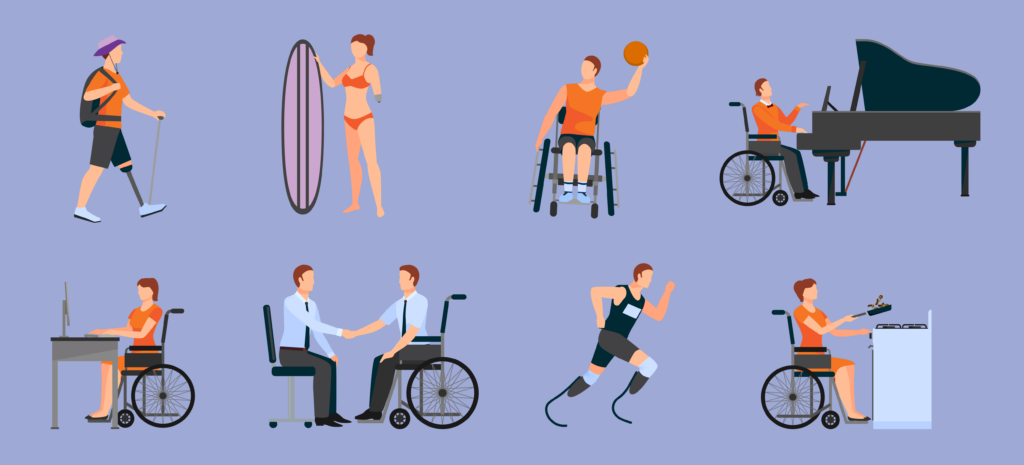
Canada is home to a significant number of individuals with disabilities, who face a diverse range of impairments, limitations, or restrictions related to vision, hearing, mobility, cognitive or intellectual abilities. The impact of disabilities on people is complicated and multifaceted.
This visualization delves into the proportions of Canadians with disabilities compared to those without. Furthermore, we explore the employment landscape, and examine the employment rate for individuals with disabilities.
To answer our questions, we used several datasets from Statistics Canada. The specific datasets we used are:
- Persons with and without disabilities aged 15 years and over, census metropolitan areas
- Labour force status for persons with disabilities aged 25 to 64 years, by disability type (grouped)
- A demographic, employment and income profile of Canadians with disabilities aged 15 years and over, 2017
Visualizing the data
First, we plotted the employment status of individuals with various types of disabilities:
This visualization illustrates how the ability of a person with disability to secure employment varies based on the type(s) of disability they have. Notice when you sum the number of individuals with each type of disability, it exceeds the total population with disabilities. (If you stack each bar in the graph, you would get a bar taller than the ‘total’ at the start.)
To explain this discrepancy, Statistics Canada notes that: “Individuals may have more than one type of disability or grouped disability; therefore, the sum of all individual disability types is greater than the number of ‘total disabilities’. Cognitive disability includes learning, developmental and memory disabilities.”
- What do you find interesting about the visualization above?
- Why do you think the employment status of people changes based on their specific disability?
The next visualization shows the ability of individuals with milder and more severe disabilities to attain employment, compared to those without disabilities.
Do you have any theories to explain the differences noted above?
The graph shows that individuals with severe disabilities face more pronounced challenges in securing employment compared to those without disabilities or with minor disabilities. The determination of ‘severe’ or ‘milder’ disability is based on a number of factors in the Canadian Survey on Disability.
For further insight, refer to the Jupyter notebook used to create the visualizations.
*It is important to note the Jupyter notebook references a research paper that uses information from the perspective of employers. When examining reasons for a trend in the lives of individuals in a specific group, such as individuals with disabilities, it is generally important to consult the people in that group.
Reflect on what you see
From the visualizations above, it is apparent that people with disabilities often face significant challenges in securing employment. To advance as a society, it’s imperative that we adapt employment strategies to ensure equal opportunities for all members of society.
Look and interact with the data visualizations above. When you hover your mouse over the plots, you’ll notice that more information appears. Clicking on the legend of the graphs will also make the respective plots appear or disappear.
Think about the following questions.
- What do you notice about the graph?
- What do you wonder about the data?
Use the fill-in-the-blank prompts to summarize your thoughts.
- “I used to think _______”
- “Now I think _______”
- “I wish I knew more about _______”
- “These data visualizations remind me of _______”
- "I really like _______”
Learn how we visualized the data
Go to our walk-through (in Jupyter notebook format) to see how the data science process was applied to create these graphs, from formulating a question to gathering the data and analyzing the data with code.